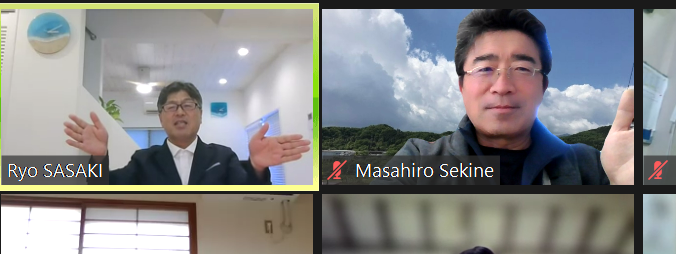
ラーンウェル代表の関根です。
2023年12月19日、21日、22日の3日間、Zoomで、IDCJ主催「39th Professional Statistical Workshop」に参加しました。
講師は、Western Michigan Universityの佐々木亮先生。2日目は「Impact evaluationをするためのエクセルでの統計分析」ワークショップ(t-test)です。
私の理解の範囲で、学びになった点を記録に残し、共有します。(佐々木先生に許可を得て掲載)
===
International Development Center of Japan (IDCJ) 39th Professional Statistical Workshop
2023年12月21日(木)
9時30分~
●Self-introduction
・各国から、13名が参加。
・少人数グループでの意見交換を予定
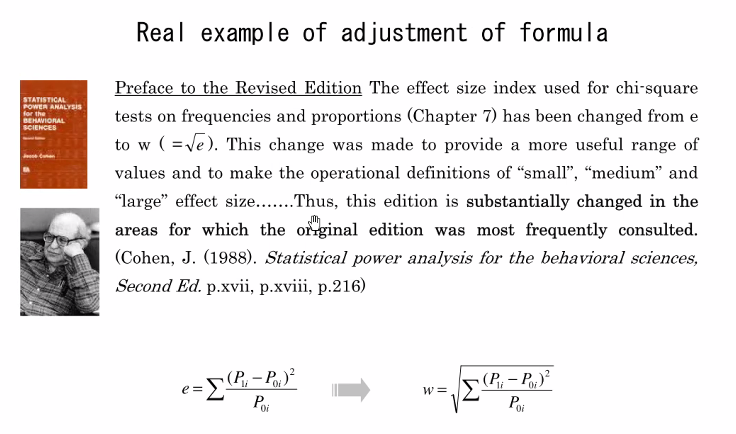
・p15
・Cohen自身が、効果量を求めるFormulaの誤りを認めて、Formulaを変えた。
●質問
Q.How much sample size do we need?
A.25~30は必要
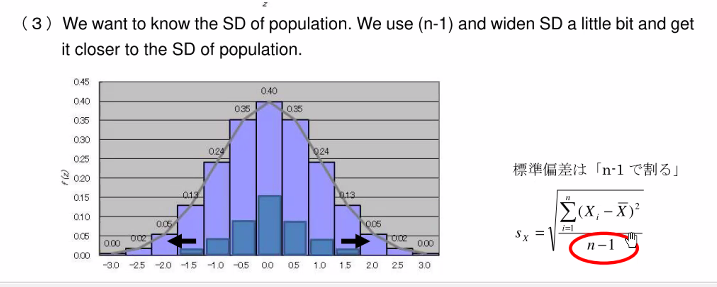
・Sample標本<Population母集団
・サンプルサイズが、25~30あると、Standard deviation 標準偏差が、Populationに近くなる。
・30のサンプルサイズなら、クライアントとも合意しやすい。
・学術論文でも、サンプルサイズ n=30 が多い。
10時10分~
●Dependent t-test (Before-After t-test)
・p16
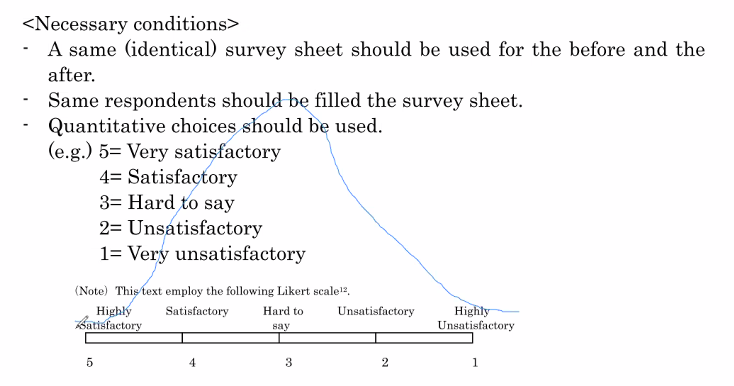
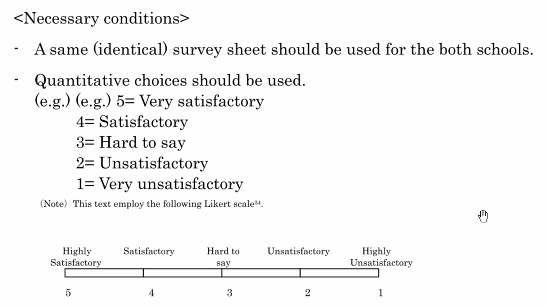
・前後で「同じ質問紙」を「同じ対象者」に実施する。
・自然のベルカーブにならず、少し傾いていたとしても、統計分析には、問題ない。
・ピークが一つ、両側に下がっている、外れ値が無いなら、OK。
・5-point scale でも、4-point scale でも、どちらでもOK。分析結果は同じになる。
・54321、4321が、最も広く使われている。
・4-point scale は、Yes or Noになる。どちらかに決めることを求める。
・5-point scale には、中間がある。
・Healthcareの人達は、4を好む。社会科学の人たちは、5を好む。
・Normal distributionになりやすい、5を勧める。
(参考 テキスト2 p2)
・カイ二乗検定のみなら、4でOK。
・重回帰分析をしていきたいなら、5がお薦め。
・t検定
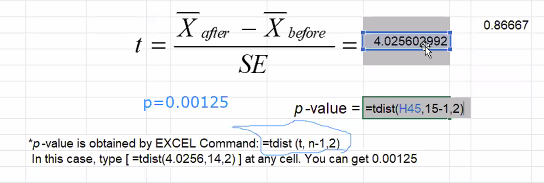
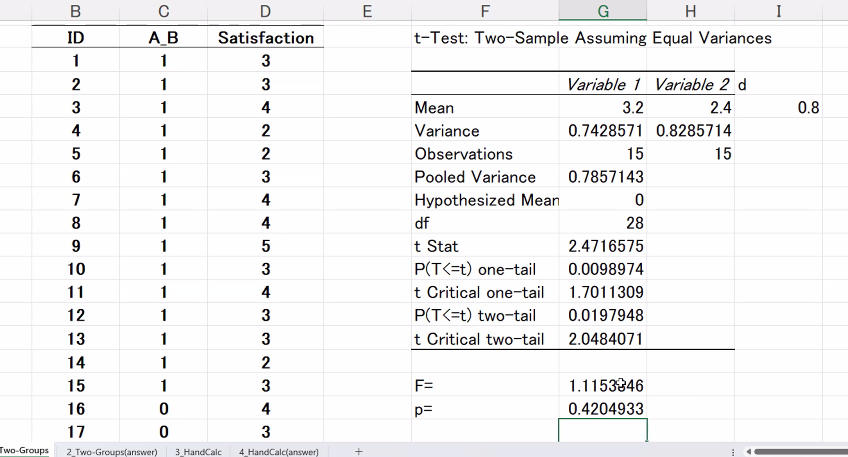
●Excel calculation
○佐々木先生の「ダブルクリック カチカチ!」いいな~。
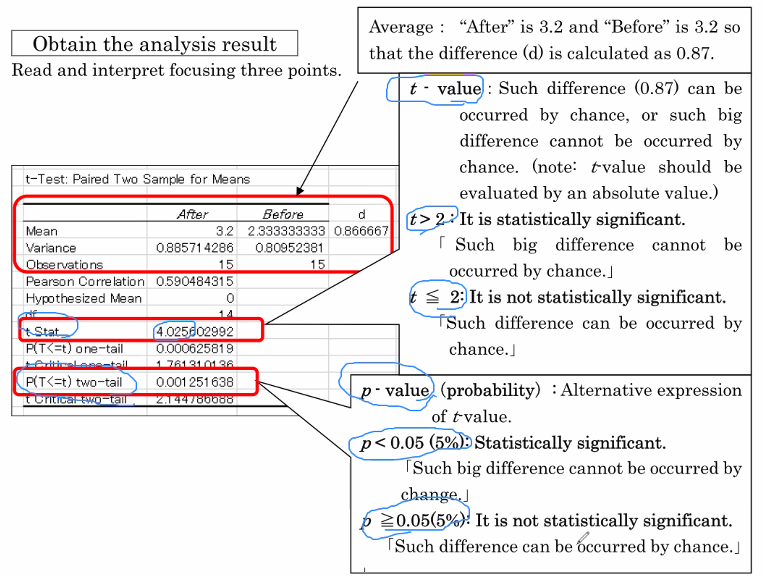
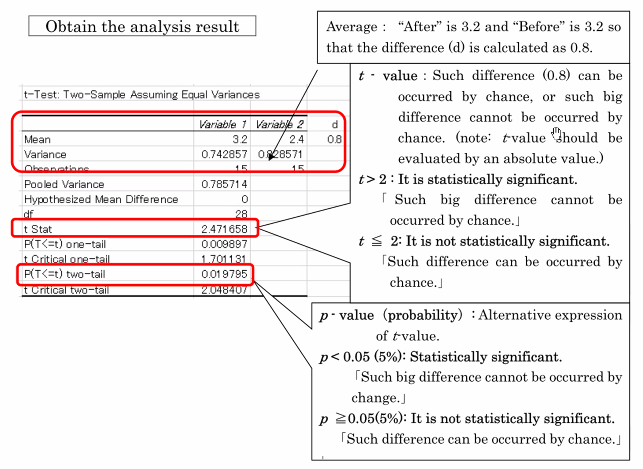
・t-value と、p-valueの両方を載せる必要があるのか?
・t が、2以上なら、pは、自動的に、5%以下になるのに。
・昔は、t-valueのみだった。今は、エクセルがあるので、両方載せられるようになった。
・今の若い研究者たちは、p-valueのみを載せるようになった。
・両方を載せた方がよい。誰も批判しない。
●質問
Q.「t-value」とは?
A. 手計算をすることで、より分かるようになる。なぜ、tが2以上なのか、なぜ、pが5%以下なのか。
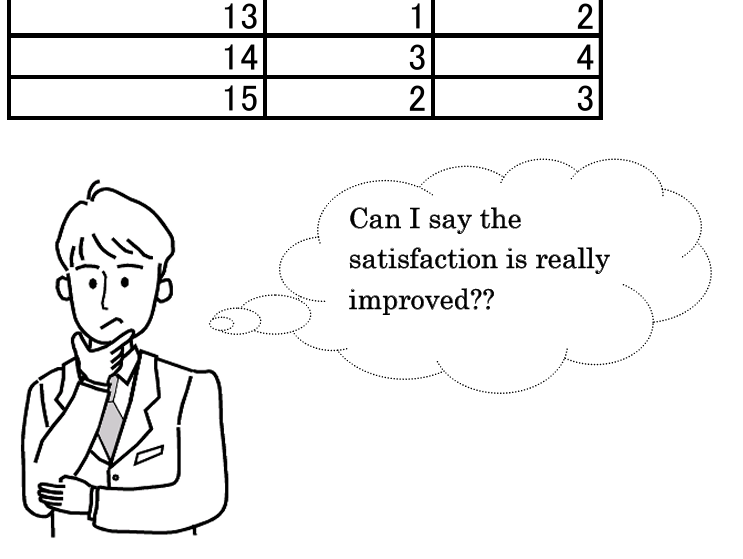
Q.前後の「0.87」の差を、どうとらえたらよいのか? improvementと?
A.介入前の平均値が、2.3であった。介入後の平均値が、3.2に上がった。improveしたと言ってよい。
11時10分~ 休憩 ~11時20分
ーーー
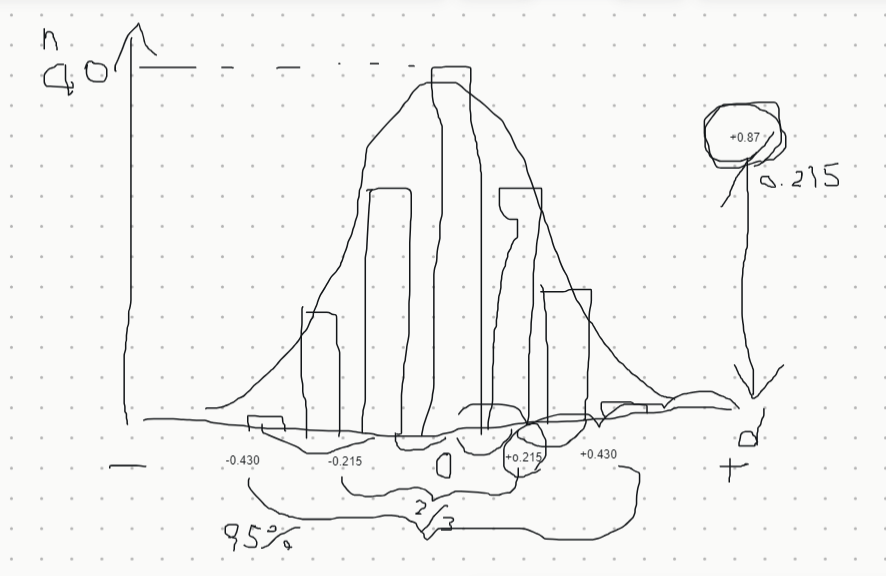
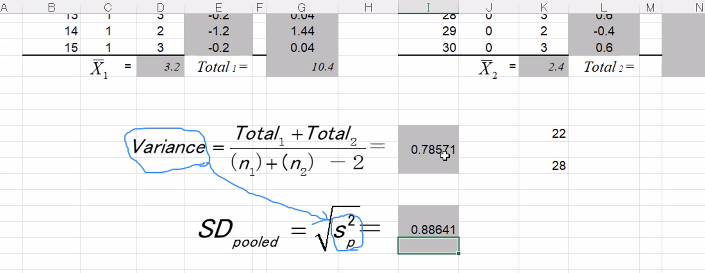
●Hand calculation
・p22
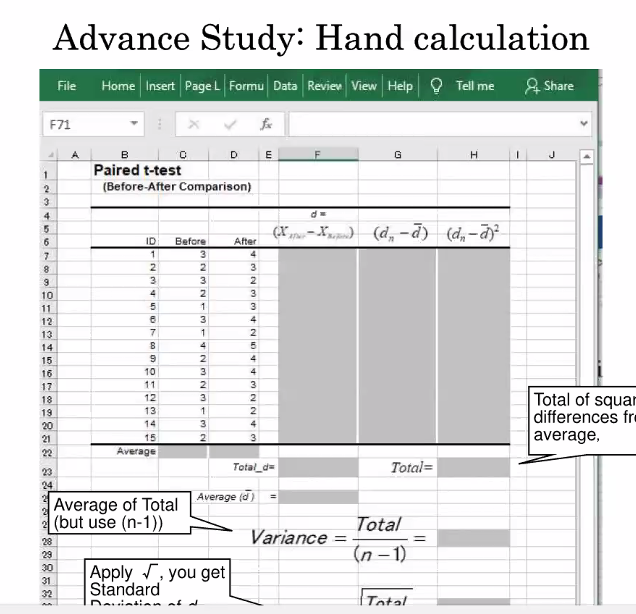
・square 二乗することで、全ての値が、+になるので、計算しやすくなる。
○できた!すっきり!
・平均値は同じ2つのグループから、サンプルを、15ずつ選んだ。
・2つのサンプルの平均値の差がどうなるか。
1)ゼロ 2)小さい 3)少し大きい 4)とても大きい
・どんな形になりそうか?
・Normal distributionになる。
・差である「0.87」は、95%以外の場所である。これが、偶然に起こる可能性は、5%以下。
・これは、今回の介入による結果であると言える。だから、この介入は効果があったと言える。
●身体で表現
○「ここが、このワークショップの見どころですよ」と、とても楽しそうな佐々木先生。
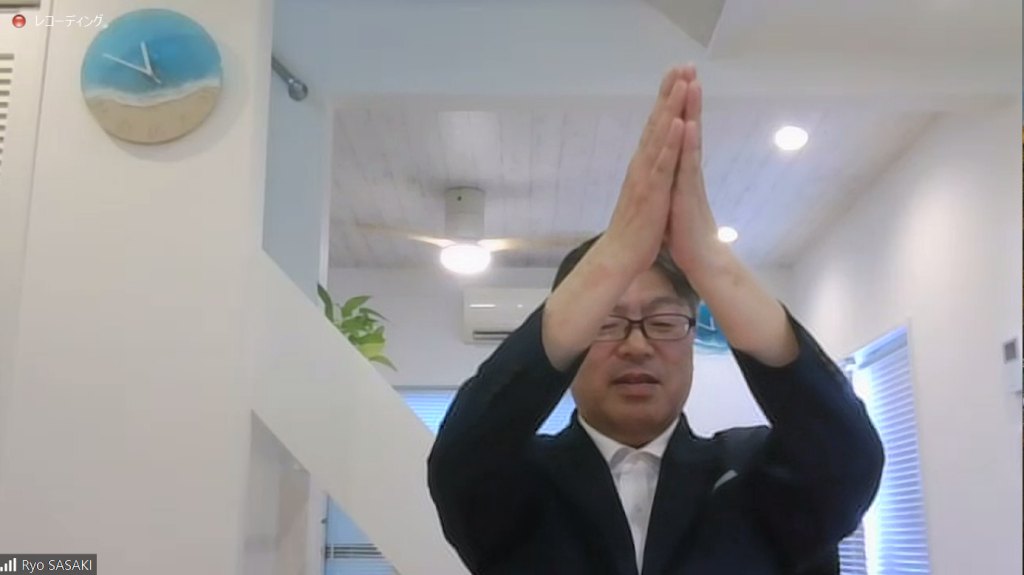
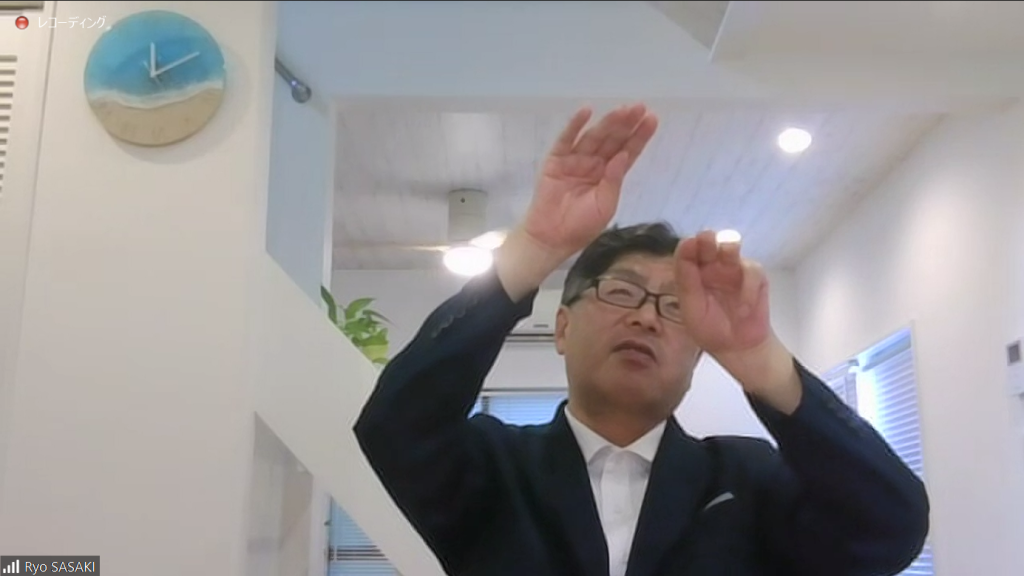
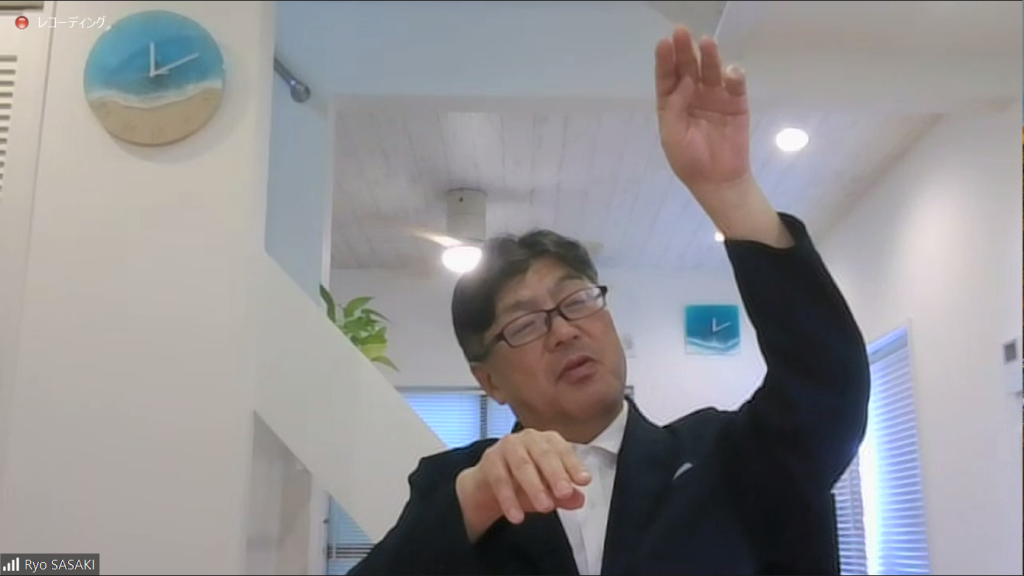
○なるほど!確かに! 有意水準5%って、こういうことだったのか! 佐々木先生、身体を使った表現、ありがとうございます! 2回見て、腑に落ちました。
●質問
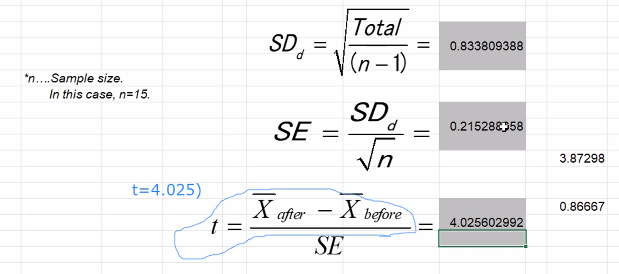
Q. なぜ、SDだけでなく、SEを使うのか?
A. t-testを開発したDr.Student(W.Gosset)が、√nで割るという法則を見つけた。それを活用している。
Q. どうやって、SDを出すのか?
A. エクセルは、Standard deviationを出さない。sqrt(Variance)を入れれば、出る。
12時20分~ 昼食休憩 ~13時20分
(冬休み前で、給食が無くなり、早く帰ってきた次男(小3)と昼食。13時、長男(中2)と息抜きにキャッチボール)
===
●Advanced Study 1: Research paper using t-statistics 1
・井戸を設置したかどうかぐらいしか、成果としては、これまでは示されなかった。
・この研究では、Socioeconomic impactを示した。それが、JICAにも支持された。
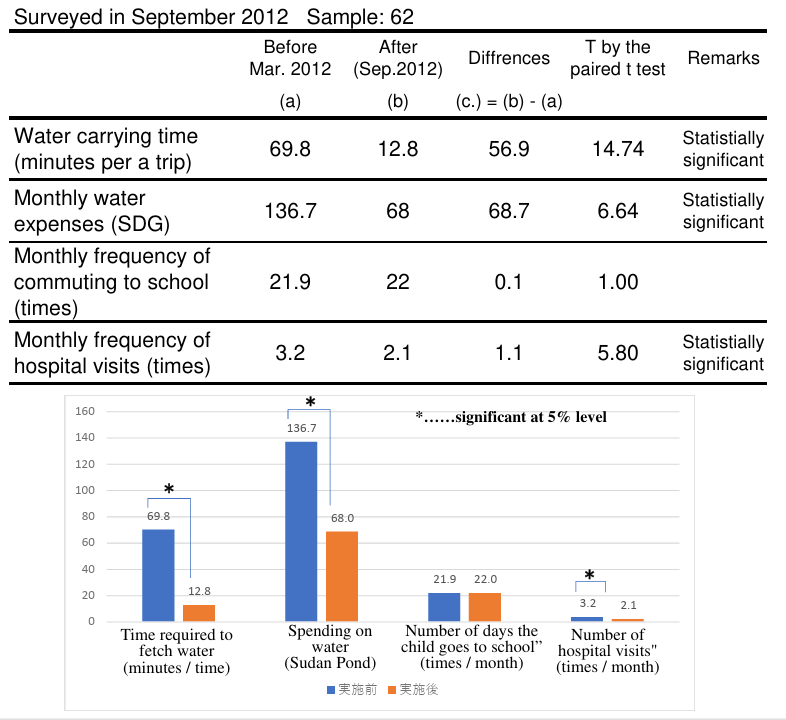
・質問紙もシンプル。1ページで十分。介入前後を訊く。
●Some great men of Statistics
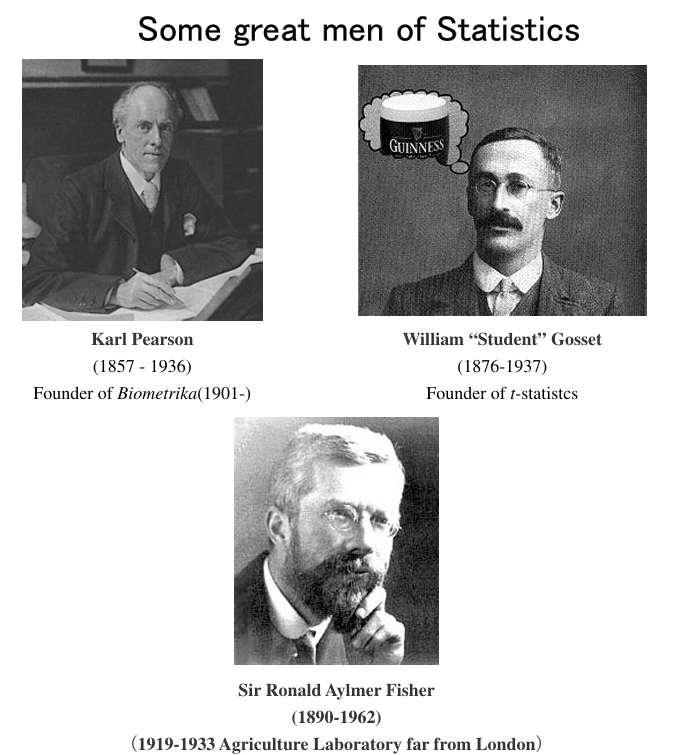
・Gossetは、ギネスビールの営業でもあった。
・Student testなら「S-test」でも良かったが、Sは既に使われていたので、t-testになった。
・Pearsonは、Marxに憧れていたので、CarlからKarlとドイツ語表現に変えた。
・Fisherと、Pearsonは、人付き合いが下手。二人の関係も悪かった。
・Gossetが、二人の間を取り持って、手紙のやりとりをした。
・Fisher(1929)~once in twenty trials.
・1/20=5%
・5%を基準とする理由を聞かれたら、Fisher(1929)が、提案したからと伝える。
・Fisherは、RCTの発明者でもある。「The Design of Experiments」(1935)
===
●Independent t-test (Two-group t-test)
・「同じ質問紙」を、2つのグループで使う。
・RCTでも、このt-testを行う。
・2グループを、1、0、で示す。
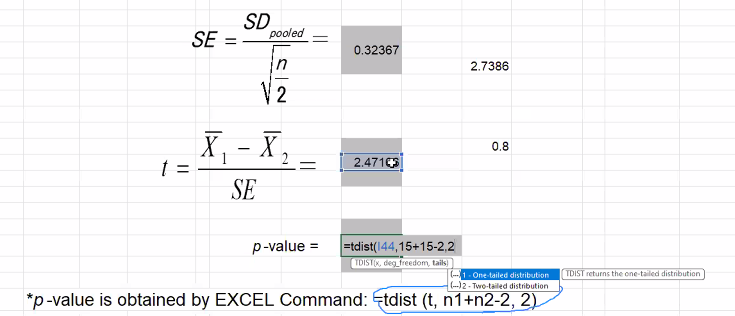
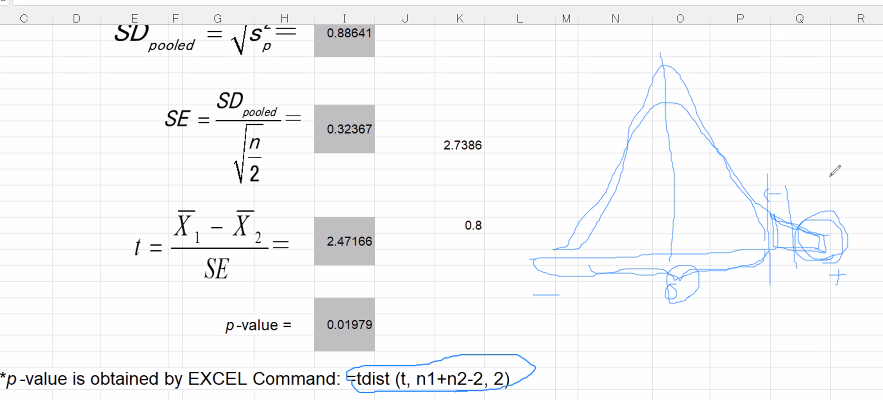
●Excel calculation
・「片側」を使うことはない、常に「両側」を見る。
・エクセルでは、SDではなく、Varianceが示される。Varianceを二乗すれば、SDが出る。
○確かにでる!
sqrt(variance)=SD
●質問
Q. Impactが出るには時間が必要。それをどう分析に入れ込む?
A. 介入直後にインパクトが出るものもあれば、介入後しばらくしてインパクトが出るものもある。JICAでは、インパクトが出るまでに、2年間必要と考えている。
介入直後および介入1年後~2年後に、インパクトを測定するのが良いのでは。
●Hand calculation
・100回の内、2回はでるかもしれないが、5%以下なので、介入に効果があったと言える。
・なぜ、2 tails(両側)を使うのか?
・1 tail(片側)だと、マイナス領域(左側)を見ない。プラスかゼロしか見ない。
・2 tails(両側)だと、プラス、ゼロ、マイナスを見る。2 tailsだと、ネガティブな変化も見ることもできる。
・get better, no change, get worse という可能性もある。だから、2 tails(両側)を見る。
○なるほど! そういうことだったんだ~。
・p37
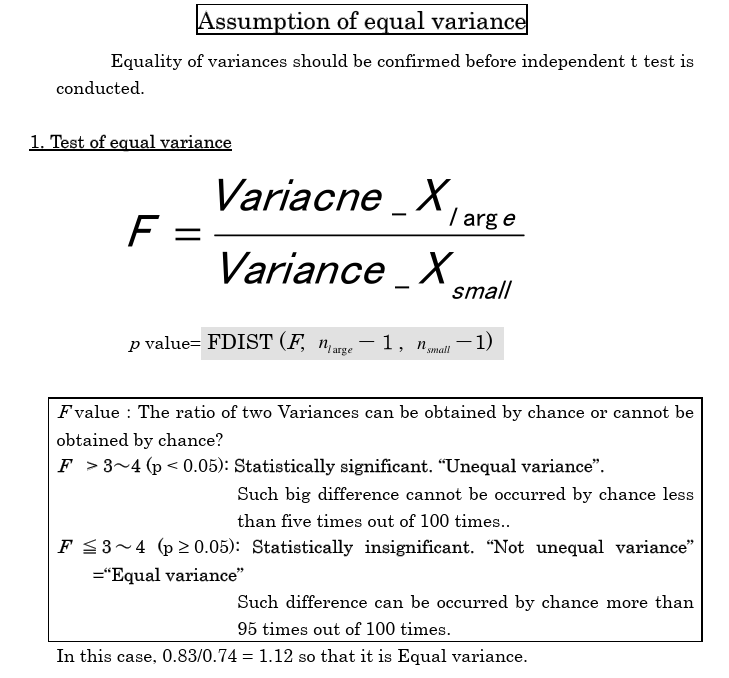
・F-value は、Fisherの名前から。
・Fが、3以下なら、Equal varianceと言える。
14時45分~ 休憩 ~ 14時55分
ーーー
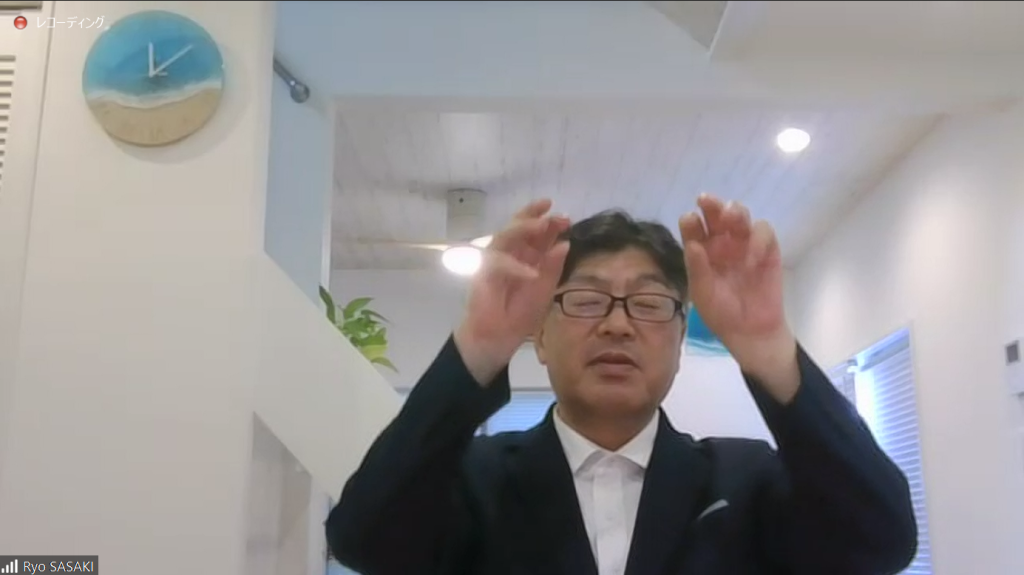
●身体で表現
・2つのグループ。平均値が同じと考えられる。
・サンプルを、15ずつ取り出した時、4つの可能性がある。 1)平均値の差がゼロ 2)少し 3)多め 4)大きい
・そうすると、次のようなDistributionになる。
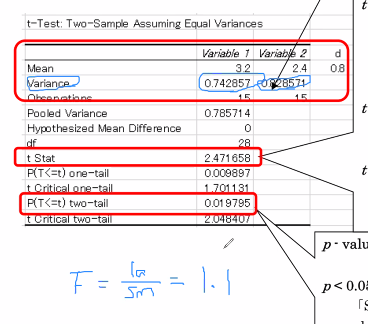
・差である「0.8」は、95%が落ちる範囲の外になる。
・この差は偶然に起こったわけではなく、介入の効果であると言える。
●皆でカメラオンで、身体で表現
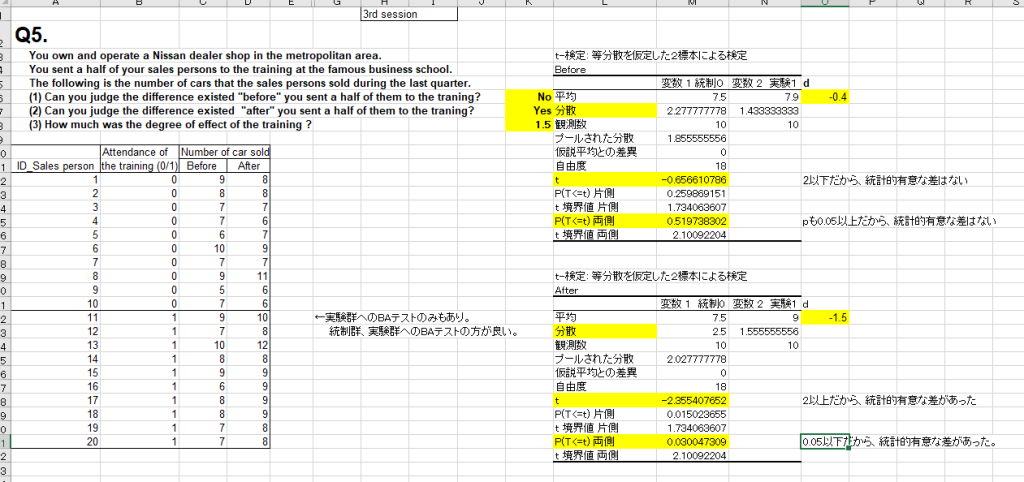
●練習問題 グループ
Q1 No
Q2 Yes
Q3 +1.5 cars DID=1.5-0.4=1.1
・Training session is effective.
Ganeshさん
・Nepal カトマンズに住んでいる。
・日本人と一緒に働いている
・日本時間15時30分 →ネパール時間12時30分
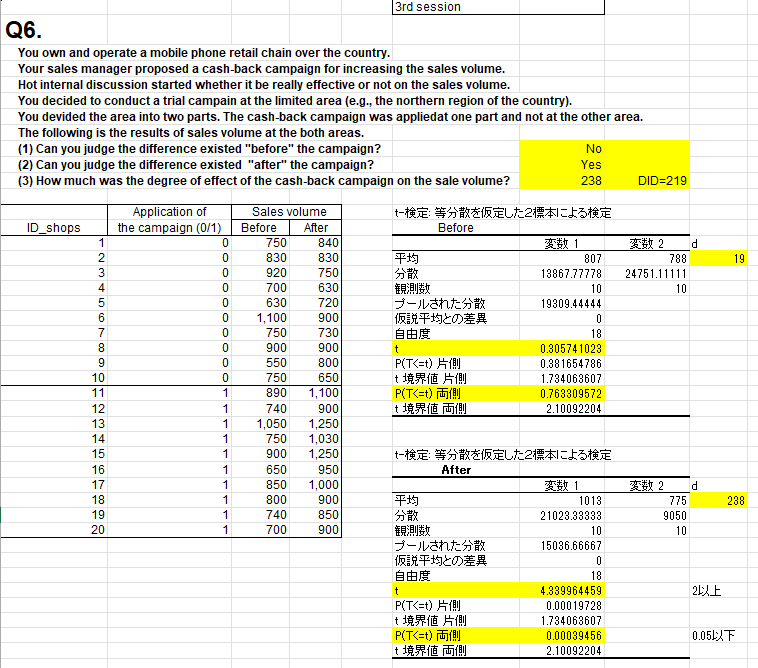
Q1 No
Q2 Yes
Q3 +238 (DID=238-19=219)
○できた!嬉しい!
15時55分~
・p42
●Practice of reading academic paper
・2グループ t-testを利用した論文。
・ノーベル賞を受賞。
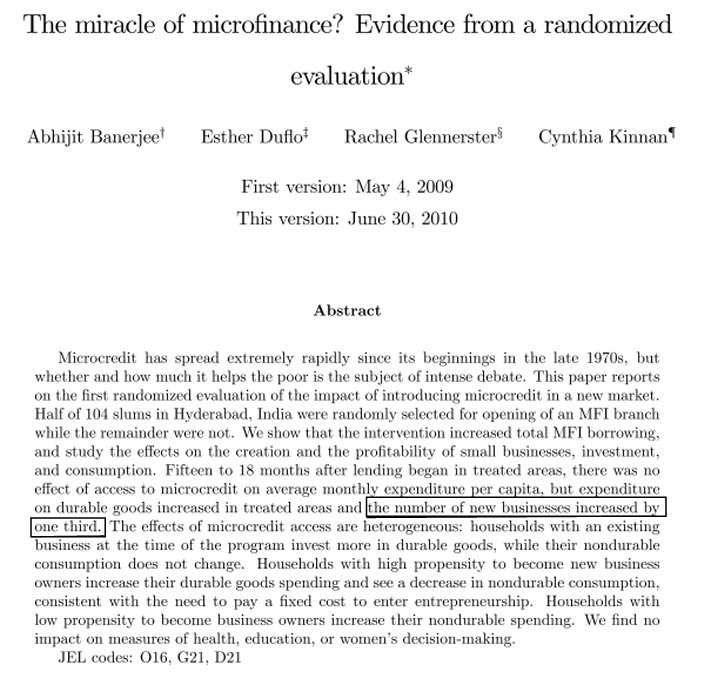
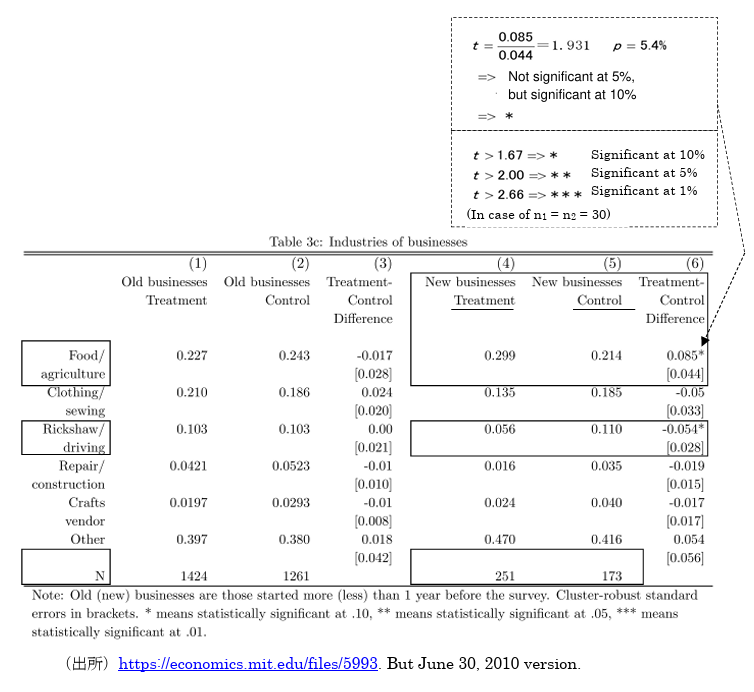
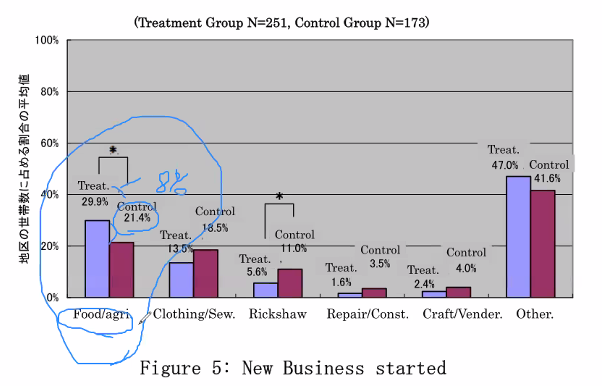
Q. Food/Agricultureしか、伸びてないのに、効果があったと言い切っていいのか?
A. 彼らは、そう言い切ろうと決めたのだろう。
ーーー
・平均値の差(Difference)/ SE( )= t-value
・tが、2以上なら、pは、5%以下になる。統計的有意!
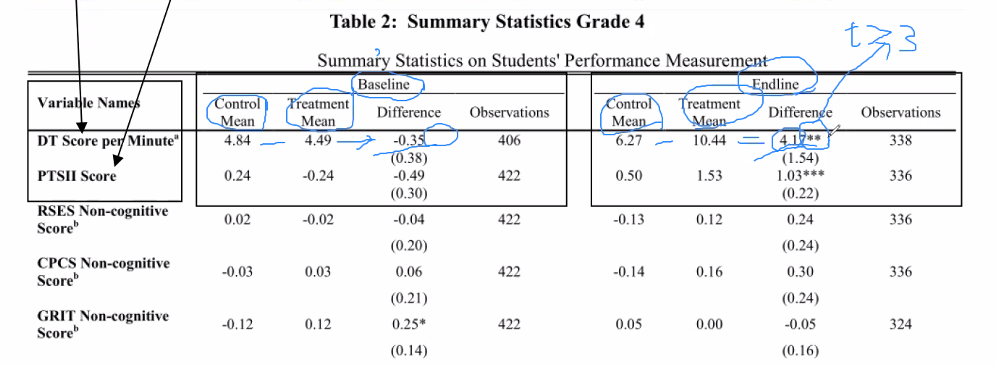
○なるほど! より細かく読み解けるようになったかも!嬉しい!
===
○今まで、もやっと霧がかかってたようなことが、はっきり見えてくる感じ! 2日目も楽しかったです。ありがとうございました。
コメントフォーム