ラーンウェル代表の関根です。
2023年12月19日、21日、22日の3日間、Zoomで、IDCJ主催「39th Professional Statistical Workshop」に参加しました。
講師は、Western Michigan Universityの佐々木亮先生。3日目は「Impact evaluationをするためのエクセルでの統計分析」ワークショップ(Multiple regression analysis)です。
私の理解の範囲で、学びになった点を記録に残し、共有します。(佐々木先生に許可を得て掲載)
===
12月22日(金)
9時30分~
●Chi-square test
・It is not by chance, but by my intervention.
・t-test は、Popular
・Chi-square test は、popular ではない。
・Yes/No の違いを見るのが、カイ二乗検定。
・カイ二乗検定の後は、他の分析ができない
・t検定の後は、他の分析(回帰分析)ができる
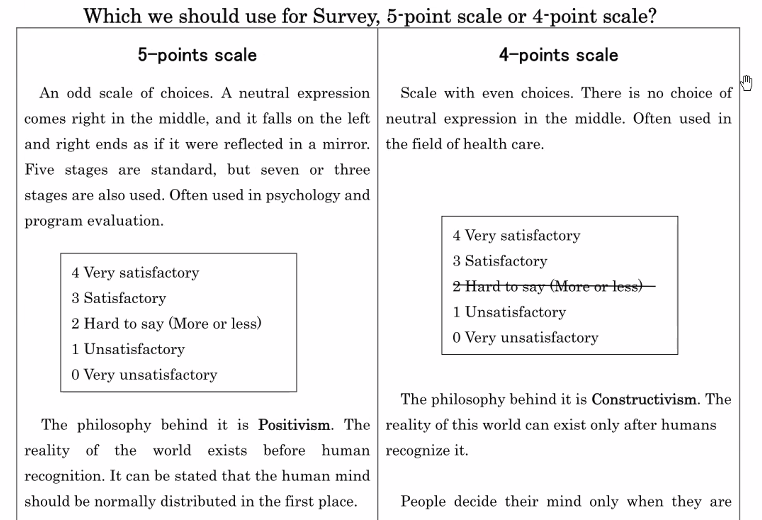
・5-points scale の背後にあるのは、Positivismの哲学。人間の認知の前に、世界の現実が存在するという考え方。
・Experimentalism のほうが、Positivismよりも、この哲学の名称として合っている。
・Realityは、既にそこにあるはずと考える。
・4-points scale の背後にあるのは、Constructivismの哲学。世界の現実は、人間が認知した後に存在するという考え方。
・人々は、尋ねられた時に、Yes/Noを決める。
・「I love you」と言った後、「あなたは、私が好き?嫌い?」と問い、答えを求めるようなもの。
・5-points scaleのほうが、複数の分析ができるからお薦め。
・「Satisfactory」と答える日本人が多い。
「Very Satisfactory」と答えるタイ人が多い。
—
1st session: Can we say that there was a difference in the ratio of “yes” and “no”? (Goodness-of-fit test)
・We assume Normal distribution
・カイは、Normal distributionのこと
・エクセルの「データ分析」は、カイ二乗検定を含んでない。
・ロータスとの戦いを制した後、エクセルは進歩していない。
・エクセルの「コマンド」で、カイ二乗検定ができる。
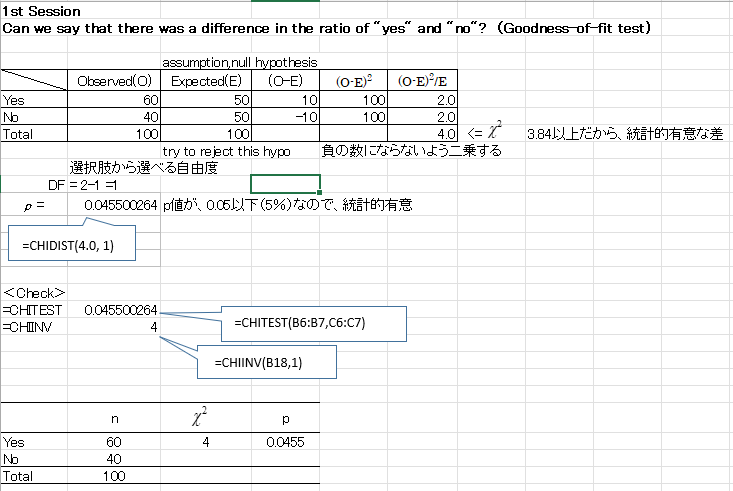
・「Yes/No」の設問だと、カイ二乗検定が使える。
・が、Impact評価では、あまり使われていない。
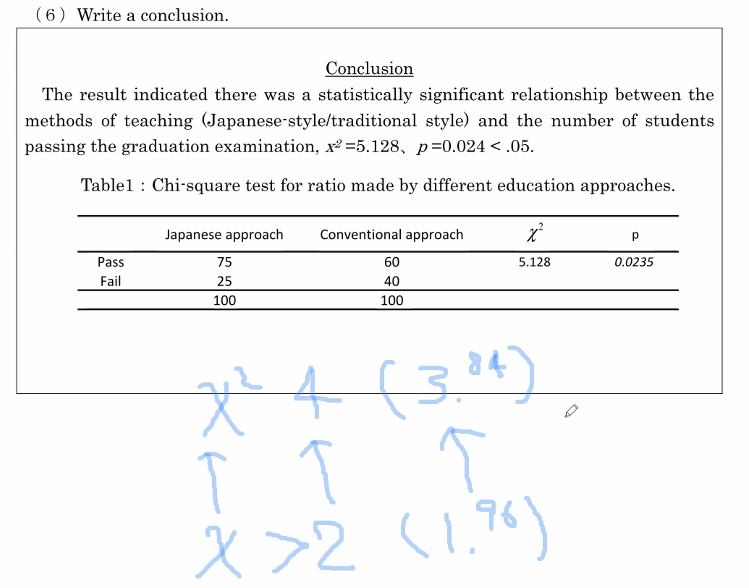
2nd session:Was there difference in the results of graduation examination between the
Japanese-style education approach and the conventional education approach?
(Chi-Square Test of Association (or Independence)
・伝統的なアフリカでの教育は「Chalk and Talk」
・そこに、日本的な教育方法を実施。
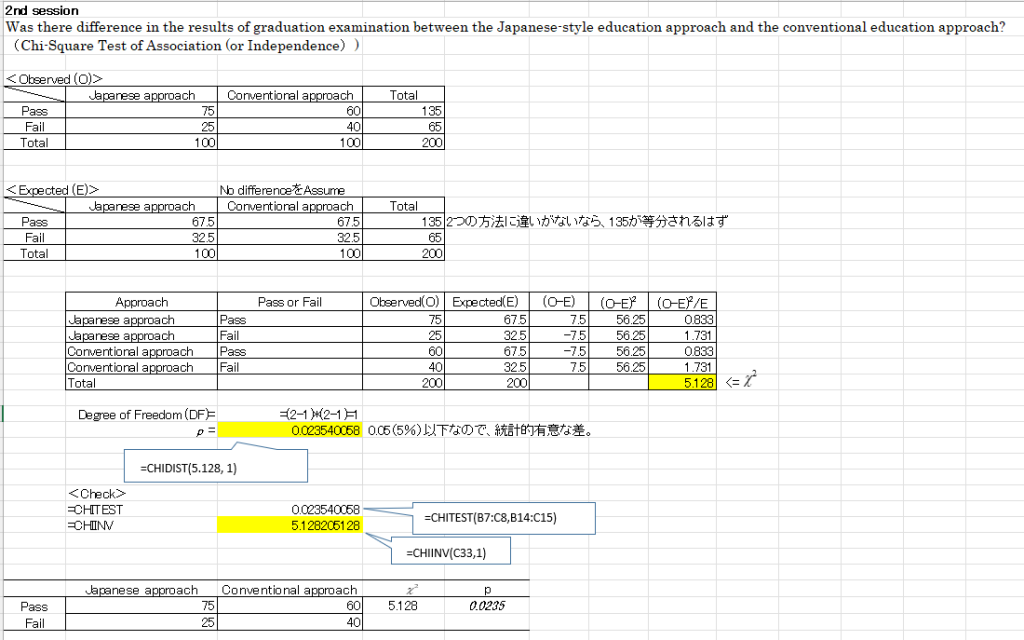
・カイ二乗値 5.128は、3.84より大きいので、差は統計的に有意であった。it’s not by chance but by my intervention.
・p値もチェック。カイ二乗値が、3.84以上だったので、p値もおそらく、0.05以下になるとは思うが、チェック。
Q. How did you get the criteria no. 3.84?
A. カイ二乗は、カイ(Normal distribution)を前提としている。カイのt値は、2(正確には、1.96)。それを、二乗すると、4(3.84)。
●Practice reading academic papers1:Chi-square test
・トランプ大統領は、マラリアワクチンをうったから、コロナにかからないと言っていた。
・検証したところ、効果がない(p値=0.35 35%)ことが明らかになった。
・医薬の研究者は、カイ二乗検定を使う。社会学者は、殆ど使わない。
10時53分~ 休憩 ~ 11時03分
===
●Multiple Regression with cross-section data
・重回帰分析は、これまで、Kingであったが、今はRCTがその地位についている。
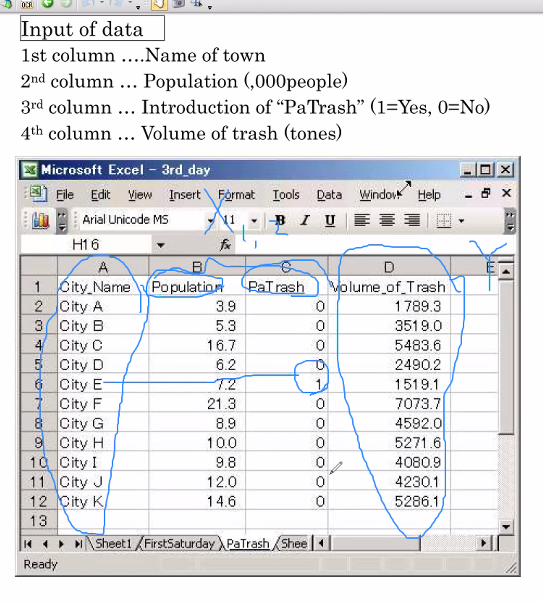
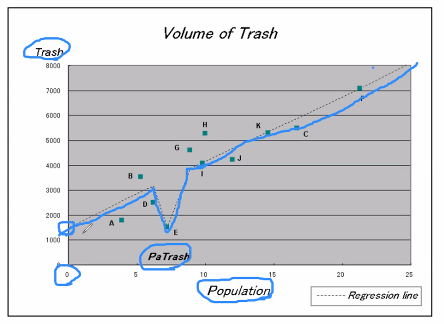
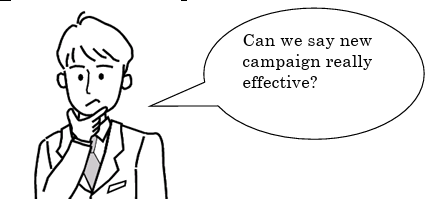
4th session: How much was the REAL effect of Your intervention? 1:
Let’s estimate the effect by comparing with your rival groups Regression analysis with cross-section data
・有料ゴミ袋は、今は普通だが、当時は新しい取り組みであった。
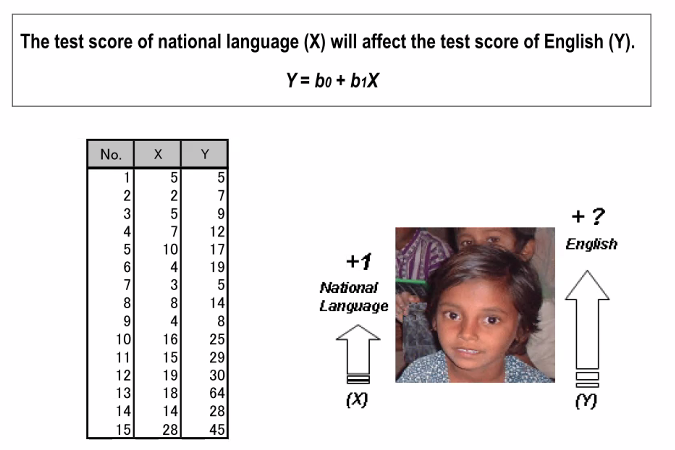
・Y=ax+b
・今回は、2つのX(人口と施策)を見る。
●Excel analysis
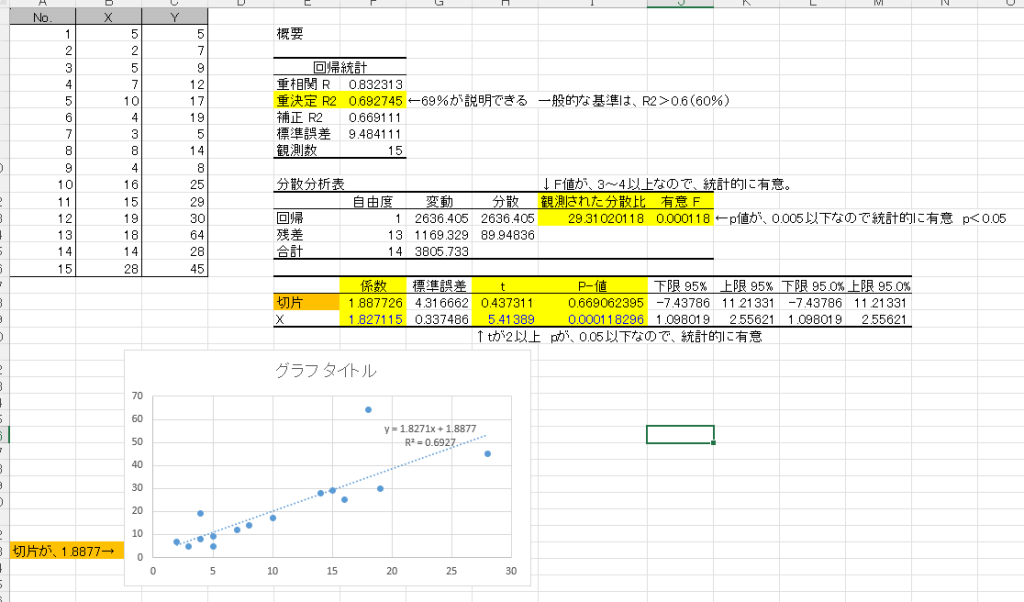
・データ分析「Regression 回帰分析」
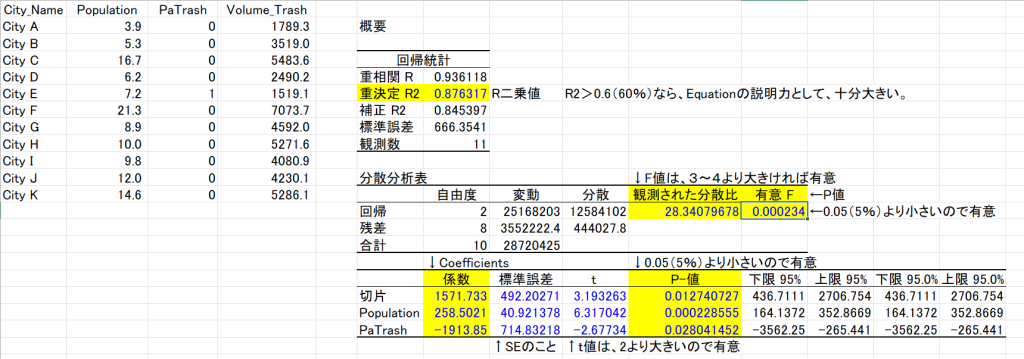
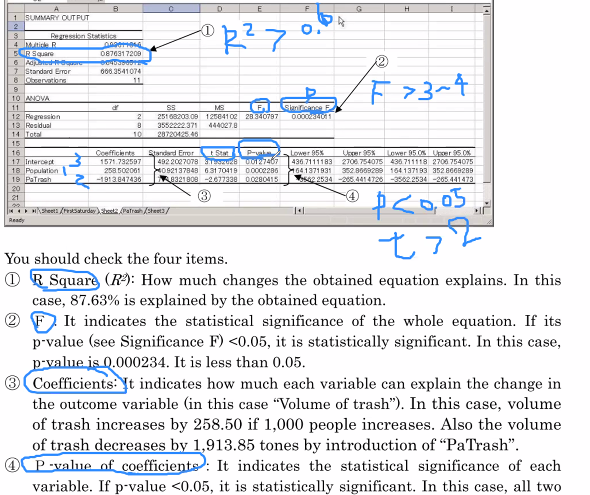
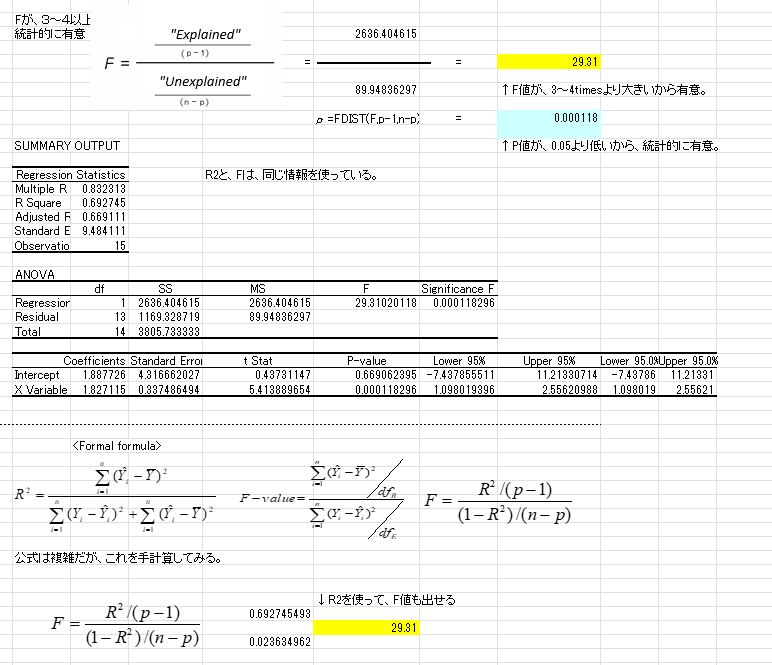
・R2=0.87(87%)
・R2>0.6(60%) R2が、60%以上だと、大きい。
・F=P値のこと エクセルでは、Fと出る。
・F>3~4
・p<0.05(5%) t>2
・人々は、表の数字は見ない。図や絵を見る。
・We assume straight line
・これが、重回帰分析の限界
・R2 Yに対するXの説明力。
How much parcentage
12時~ ランチ休憩 ~13時
===
●Hand calculation
[ 1 ] Calculation by Excel Chart Function
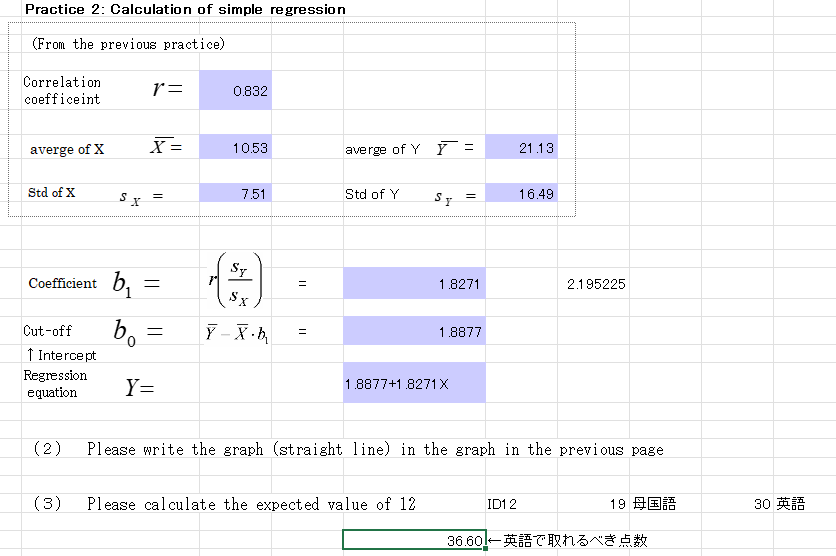
・X(説明変数)が多いと、分析が大変なため、Xが一つのSimple regression 単回帰分析を実施してみる。
・Scatter plot 散布図
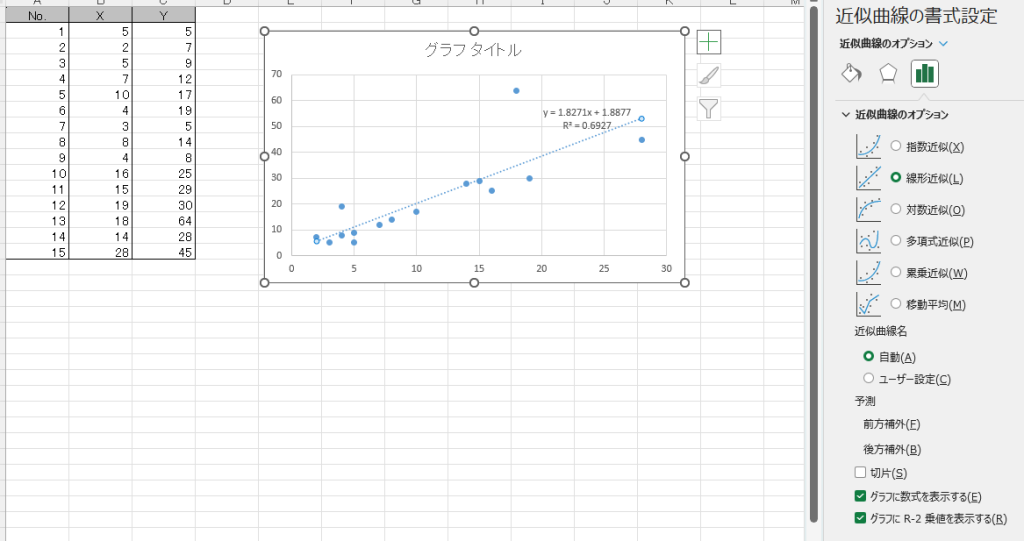
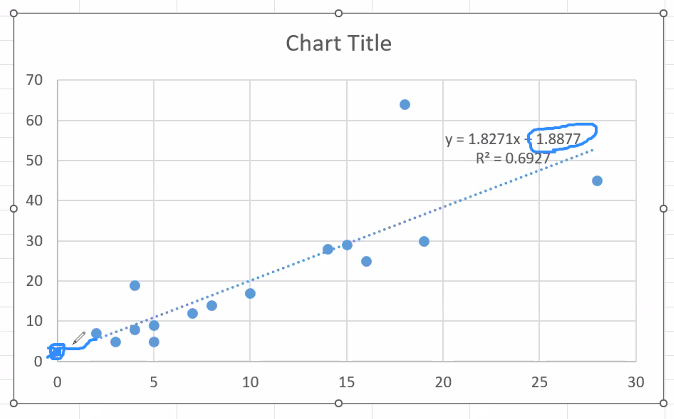
・Intercept切片が、1.8877(Y軸の途中)
[ 2 ] Calculation by Excel’s Data Analysis
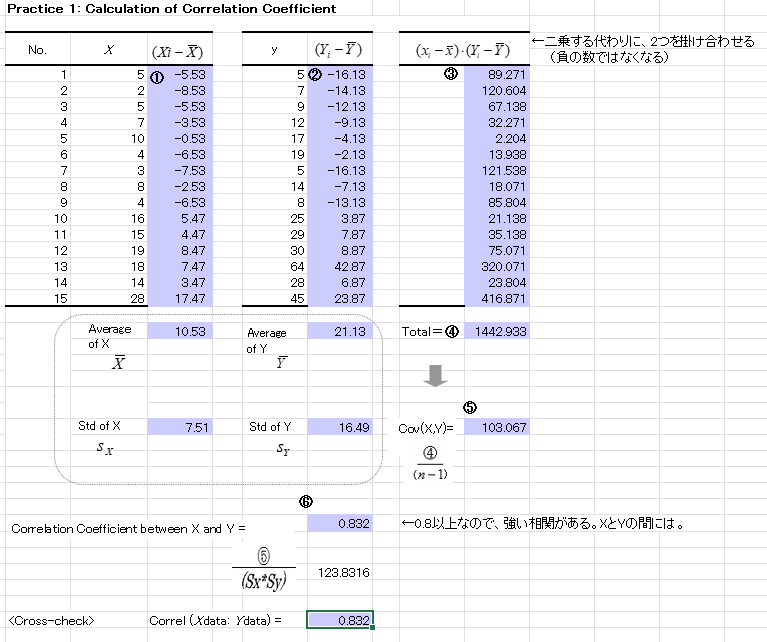
[ 3 ] Hand Calculation
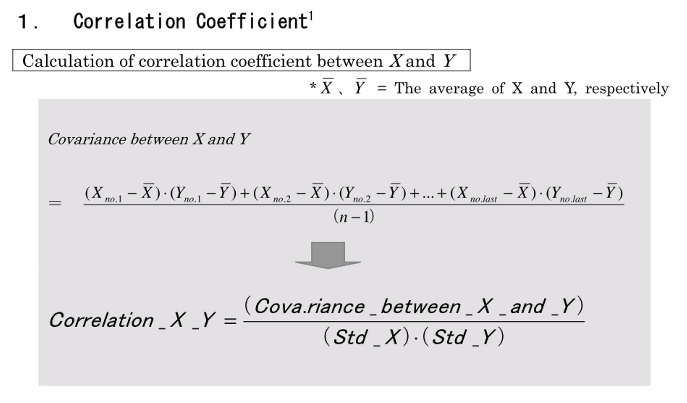
・Pearsonが提唱したCorrelation coefficient。
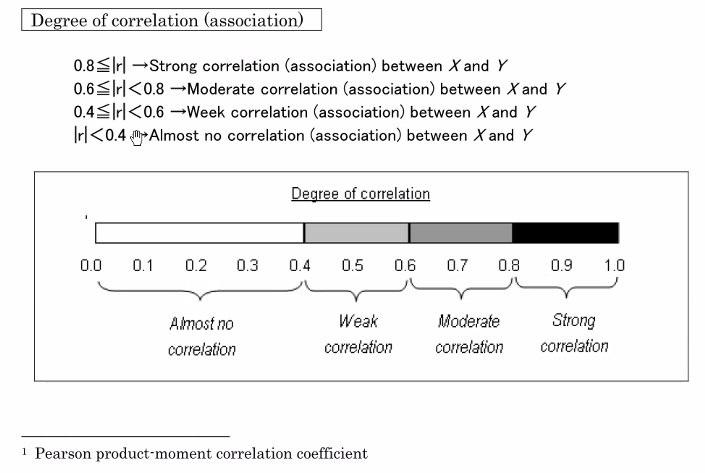
・弱い、中ぐらい、強い Correlation 相関
・分析においては、まずは、平均値を出す
Practice 2:Calculation of simple regression
14時02分~ 休憩 ~14時12分
ーーー
Practice 3: F-statistics, R2 and Adjusted R2
・まずは、Average平均を出す。
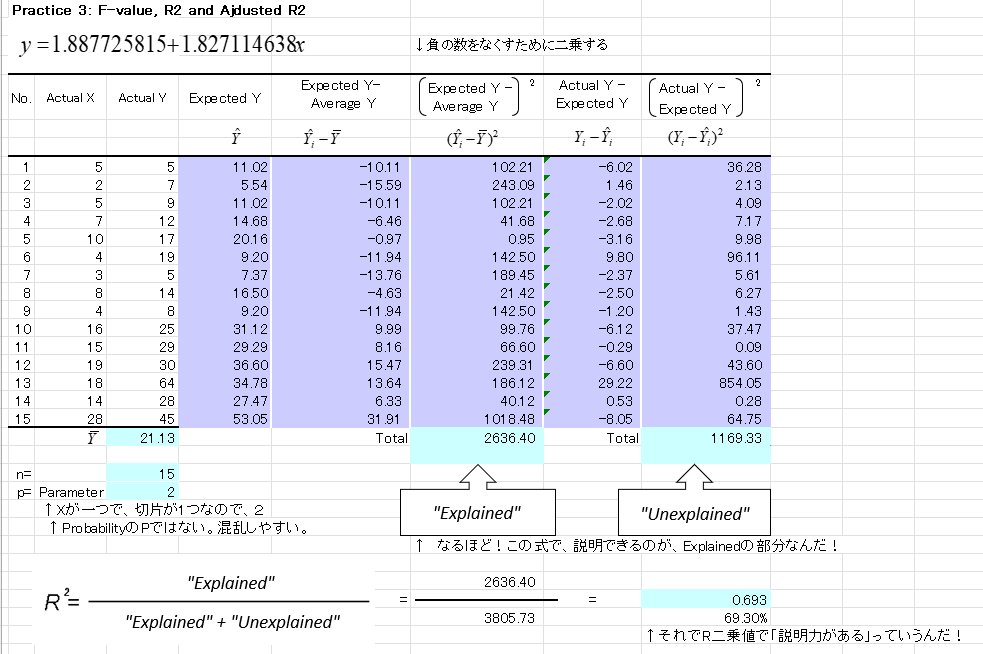
・統計は、英語圏で発展したので、26文字しかない英語の頭文字を使う。違う意味で「P」を2回使うので、混乱する(Probability、Parameter)
・そこで、ギリシャ語も入れるようになったので、更に混乱(セータ等)
●What is the meaning of R2 and F-value?
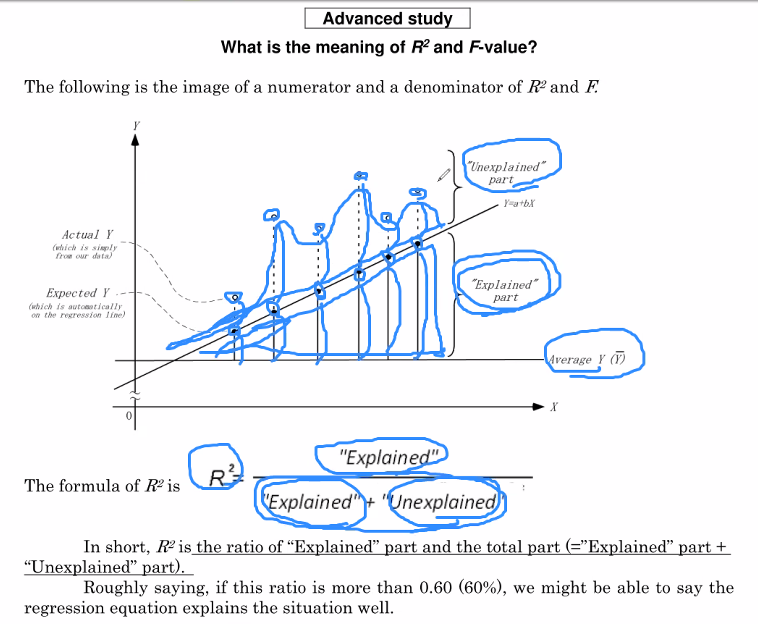
・R2は、全体の中で、どのくらい説明できるかを示している。60%以上なら高い説明力がある。
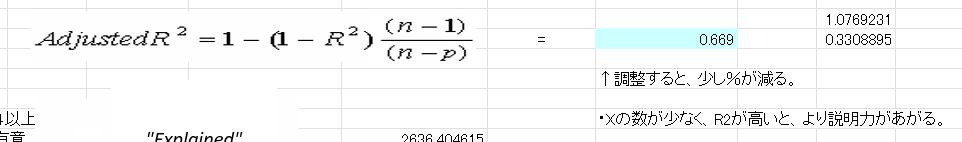
・Adjusted R2の計算
15時~ 休憩 ~15時05分
===
・Interceptが、ゼロ。それが、Natural situation.または、それが、最初のAssumption.
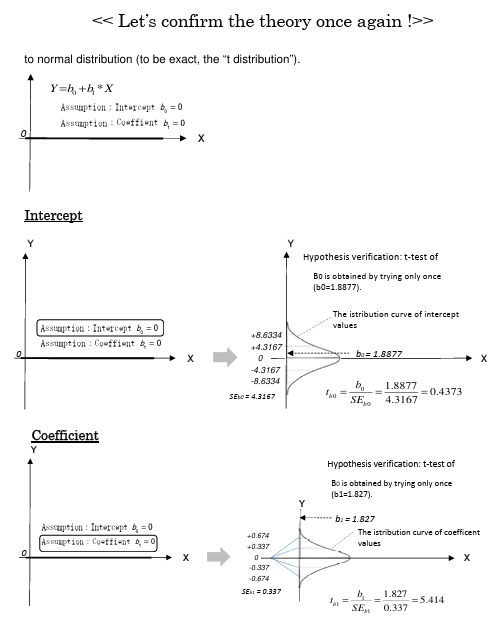
・Normal distribution shape = bell shape
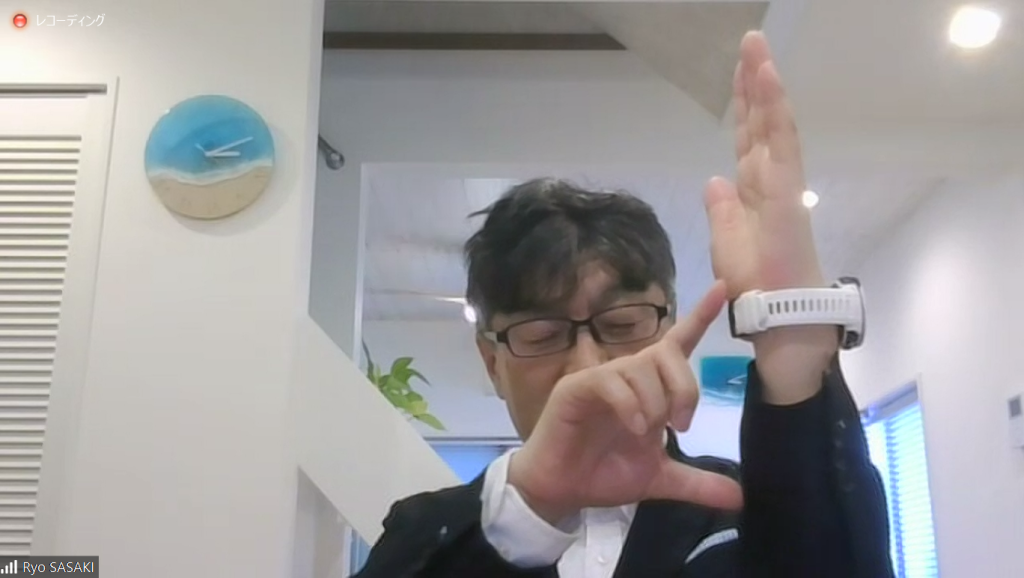
○左手で、Y軸を表現されている佐々木先生
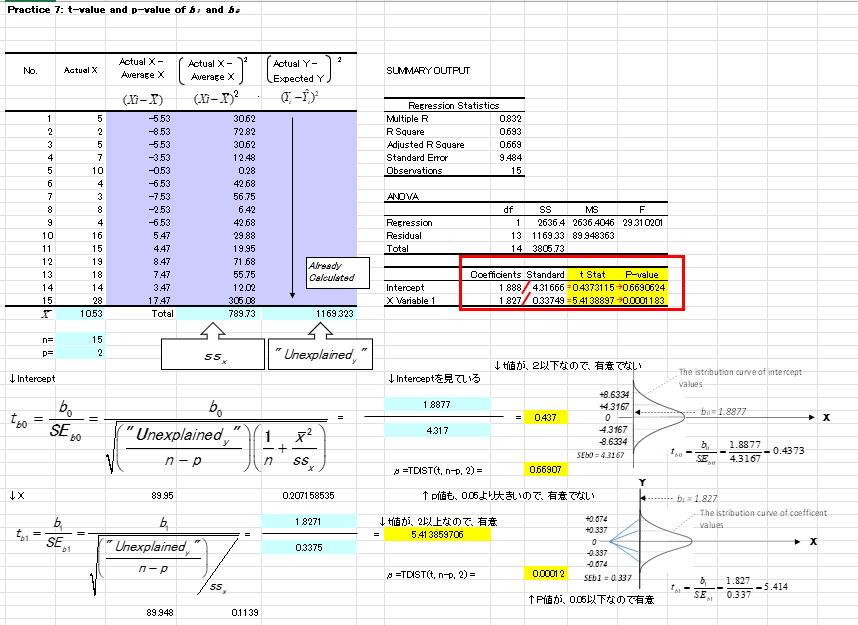
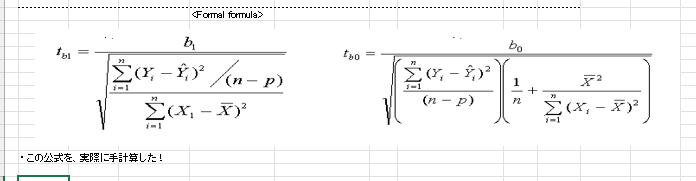
・t値とp値を、手計算で出してみる。
○この公式を、手計算した! これは凄い! でもつっかれた~。
ーーー
[ 3 ] Hand Calculation of “TrashBag” case p30
・これらも手計算でできる。佐々木先生は、8時間かかったとのこと。
15時35分~ 休憩 ~15時45分
===
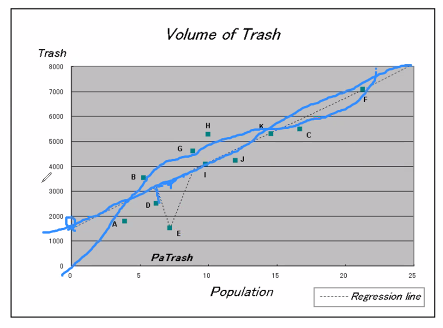
5th session:
Regression analysis with time-Series data
How much was the REAL effect of your intervention? 2:
Let’s calculate the effect from the past trend.
[ 1 ] Excel Calculation
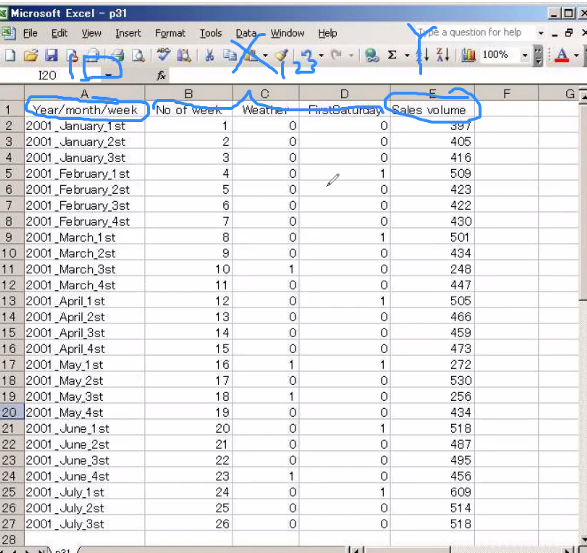
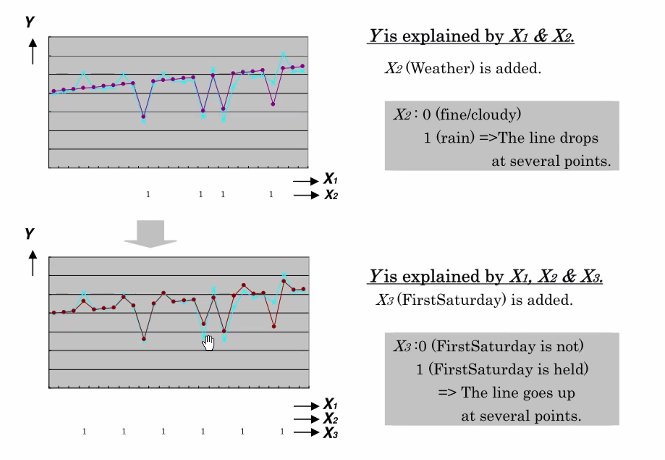
・3つのX
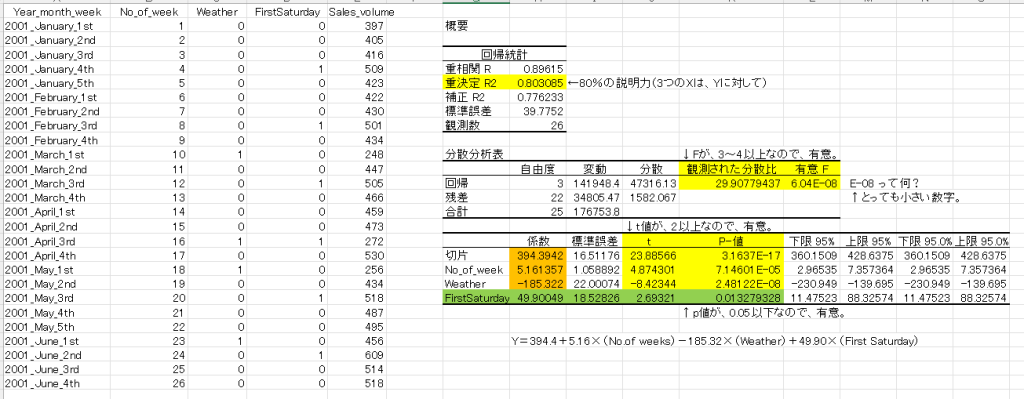
・エクセルの「データ分析」→「回帰分析」で計算。
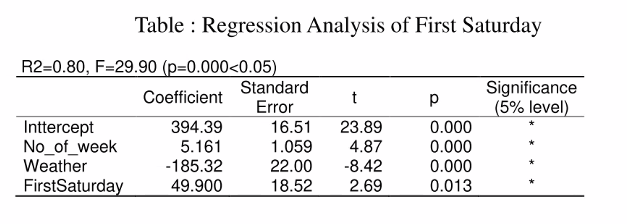
・グラフ
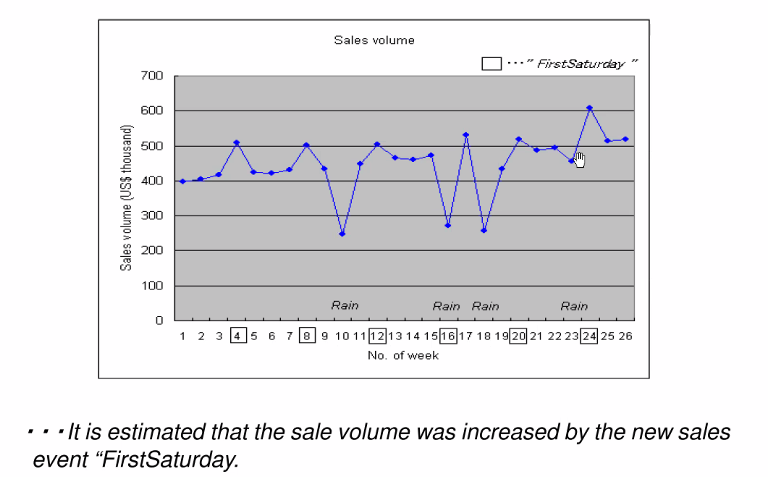
・チャートを入れると、読み手にとってわかりやすい。
Q. どうやって、適切なXを選べばよいのか?
A. 他のXの可能性もある。
重回帰分析を複数回行い、統計的有意でないXを削除していく。
===
●Practice of reading academic papers : Use of Regression Analysis
●Advance Study: Regression analysis untrusted
Larry L. Orr, Ph.D.
・重回帰分析は、Fishingのように、Xを釣り上げるようなもの。
・RCTの方が、信頼できるとコメント。
・RCTのほうが、よりポピュラーになってくる。
16時30分~
===
●How to study staistics: Case of Stanford University
・Dr. Keiichi TAKAKI
17時、終了!
===
3日間、ありがとうございました! このワークショップに参加して、ほんと良かったです!
早速、
・研修前後で訊く質問紙調査を行い
・BAテストを、t検定で行い(エクセルで分析)
・Impact評価をしてみたい と思います。
改めて、学ぶ楽しさを味合わせて頂き、学んだことを使ってみたくなる気持ちにして頂いた佐々木先生に感謝です。どうもありがとうございました。
===
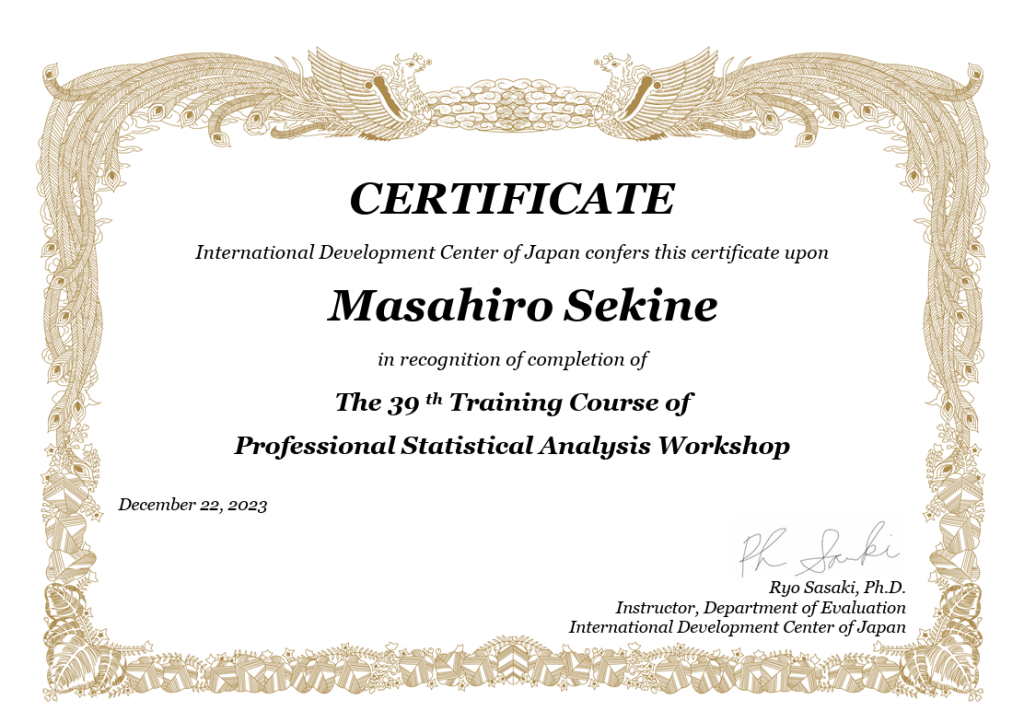
後日(12月26日)佐々木先生から、修了証を頂きました。ありがとうございます!
コメントフォーム